





EJF Investments (LON:EJFI) is an unusual investment trust that gives UK investors access to credit and structured finance linked mainly to smaller US banks and insurance companies, a specialist area of the US financial system.
It is not a conventional equity income trust. Instead, it aims to generate risk-adjusted returns through regular dividends and long-term capital growth, with a stated target of roughly 8%-10% total returns a year.
| EJF Investments (LON:EJFI) | Price: 137p (+10.9% YTD) | Market cap: £79.6m |
For investors prepared to accept specialist credit risk, EJF’s combination of an 8%-plus dividend yield, double-digit recent returns and a sizeable discount to NAV makes it interesting, especially as an equity portfolio diversifier. But the discount exists for a reason: the portfolio is relatively complex, relatively illiquid and exposed to US financial sector credit and interest-rate conditions.
What does EJF Investments do?
EJF primarily invests in regulated debt issued by smaller US banks and insurance companies. A significant part of the portfolio is held through collateralised debt obligation (CDOs) equity tranches and securitisations, alongside Credit Risk Transfer (CRT) investments and US bank debt.
It also owns a 49% interest in EJF CDO Manager LLC, giving shareholders exposure to management fee income generated from CDOs managed by EJF Capital.
That makes EJF rather different from a conventional investment trust holding shares in banks. Its returns are driven principally by interest income, credit performance, securitisation returns, management fee income, foreign exchange movements and changes in the value of its underlying investments.
On 30 September 2026, securitisations and related investments were about £85.7m, while the company had NAV of £101.5m.
Key numbers
| Metric | Latest |
| Share price | 137p |
| NAV per share | 175.7p |
| NAV discount | ~22% |
| Market cap | £79.6m |
| Dividend target | 11.45p (FY 2026, 31 Dec) |
| Dividend yield | ~8.4% |
| Ongoing charge | 1.9% |
| Net gearing | ~7% |
| Target total return | 8%-10% pa |
| Dividend frequency | Quarterly |
Latest AIC data put the shares at 137p against NAV of 175.7p, a ~22% discount, with an indicated dividend yield of 7.95%; the company’s own latest figures show NAV of 175p and a share price of 137p.
The small differences between sources reflect different NAV dates and market price timings.
A strong recent return record
The most striking feature of EJF’s recent performance is that the NAV has continued to compound despite the difficult credit environment, while the share price has additionally benefited from some narrowing of the discount.
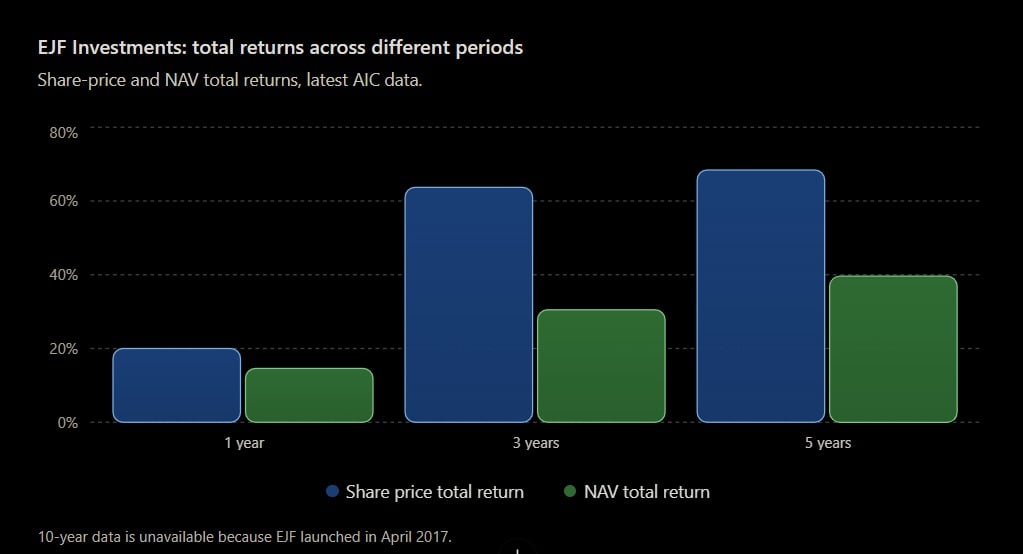
The AIC’s latest performance data show:
| Period | Share price total return | NAV total return |
| YTD 2026* | ~18% | 13.1% |
| 1 year | 20.0% | 14.6% |
| 3 years | 63.7% | 30.5% |
| 5 years | 68.4% | 39.6% |
| 10 years | N/A | N/A |
*Approximate share price YTD return calculated from the 123.5p 31 December 2025 price to 137p, including 2026 dividends declared to date. NAV YTD is the company’s reported monthly compounded return through September.
The AIC confirms the 1-, 3- and 5-year figures and shows that share price returns have substantially exceeded NAV returns over those periods.
That difference is important. EJF itself has generated solid underlying returns, but shareholders have also benefited as the market discount has narrowed.
The company’s own results show that its NAV total return in H1 2026 was 8.98%, including dividends and FX, taking total return since launch in April 2017 to 125.17%, equivalent to about 9.28% annualised.
The September factsheet subsequently showed 13.07% NAV total return for 2026 to the end of September.
The dividend is a major attraction
Income is arguably EJF’s clearest selling point.
The company paid 10.7p a share in 2023 and 2024, while the 2025 declared dividend rose to 10.9p. For 2026, the target has increased to 11.45p, paid quarterly at approximately 2.8625p per share.
At 137p, that equates to a prospective yield of approximately 8.4%.
That is attractive compared with mainstream equity income investment trusts, which average around 4.1% (UK) and 3.5% (Global) respectively, according to 2025 AIC data. But investors should remember that a high yield is partly compensation for the risks associated with EJF’s underlying credit portfolio and relatively small size.
What about the discount to NAV?
This is arguably the most interesting part of the investment case.
EJF currently trades at roughly a 22% discount to NAV. That is considerably narrower than the extreme discount seen in 2023, when it reached approximately 42%, but it remains substantial, with significant scope to narrow further if sentiment improves.
Historical snapshots illustrate the improvement:
| Date | Discount to NAV |
| Dec 2024 | 27.3% |
| Jun 2025 | 23.9% |
| Dec 2025 | 24.2% |
| Feb 2026 | 19.6% |
| Jun 2026 | 24.0% |
| Aug 2026 | 18.6% |
| Latest | ~22% |
Morningstar’s August data put the 12-month average discount at about 22.4%, meaning the current discount is broadly around its recent average rather than an exceptionally cheap entry point.
However, compared with the 2023-24 extremes, the valuation has improved materially.
Pros and cons for investors
| Pros | Cons |
| ~8.4% prospective dividend yield | Specialist and relatively complex portfolio |
| Strong 1-, 3- and 5-year share price returns | Exposure to US bank and insurance credit |
| 13.1% NAV return YTD to September | Interest-rate and credit-cycle sensitivity |
| 125% total return since launch | Small £80m-ish market capitalisation |
| Quarterly income | Share price liquidity can be limited |
| Discount gives potential upside if it narrows | Discount could remain wide or widen again |
| Diversifies conventional equity portfolios | 1.9% ongoing charge is not cheap |
| Exposure to US financial credit without simply owning bank shares | USD exposure creates FX risk for UK investors |
The principal attraction is therefore not simply the dividend. It is the combination of income + underlying NAV growth + potential discount narrowing.
The principal risk is that investors may mistake EJF for a low-risk income fund. It isn’t.
Who might EJF suit?
EJF is potentially suited to an investor who already owns conventional UK and global equities and wants to add alternative income and credit exposure.
It could have a role in an income-focused portfolio alongside, rather than instead of, mainstream equity income trusts, government bonds, corporate bonds and cash.
The trust may particularly appeal to:
- Income investors seeking an 8%-plus yield.
- Investors comfortable with US financial sector credit risk.
- Diversified portfolios looking for something different from conventional equities.
- Investors willing to hold an investment trust through periods of discount volatility.
- Investors who believe the discount can continue to narrow towards NAV.
EJFI is less obviously suitable for someone seeking a simple, transparent, low-cost core holding or investors uncomfortable with structured finance, leverage and credit risk.
Sharesify investor verdict
EJF Investments is an interesting specialist income opportunity, but it should be treated as a satellite holding rather than a core portfolio position.
The numbers are increasingly compelling: ~8.4% yield, 13.1% NAV total return YTD, 14.6% NAV total return over one year and 125% total return since launch. The share price performance has been even stronger because the discount has narrowed.
The biggest attraction from here is arguably the combination of income and a still-meaningful discount. If the underlying portfolio continues generating returns close to management’s target and the discount moves towards its historic lower levels, shareholders could benefit from both income and capital appreciation.
But investors should not ignore the other side of the equation. EJF is a specialist US credit investment trust with gearing and a complex portfolio, not a conventional dividend growth fund.
Verdict: ★★★★☆ — Attractive for experienced income and diversification investors but probably best used as a modest satellite allocation rather than a core holding.
Disclaimer: This analysis reflects the assessment of the author only and is not investment advice. Please do your own research.
You might also like:
